
Our production site died with an error that made no sense.
Loading module from ".../_app/immutable/entry/app.Cue0RkPO.js" was blocked
because of a disallowed MIME type ("text/html").
The browser asked for JavaScript and was handed HTML. Our single-page app names its chunks by content hash, so the HTML entry point and the assets it names must come from the same build. Somewhere between our deploy and the user's browser, they no longer did. And nothing in our code had changed.
We host the Dojo on HostStack, a European platform running in eu-central-1. We chose it deliberately, for the same reason we build in the open and teach from our own repositories: we think the European software ecosystem gets better when teams actually build on it, rather than admiring it from a distance while renting from a hyperscaler. This is the story of the week that conviction was tested, and of what came back when we leaned into it instead of away.
Debugging a machine you cannot see inside
A platform outage puts you in an unusual position as an engineer. You have no shell on the box. You cannot list the containers. Everything you know must come through the front door: HTTP responses, deploy logs, and the platform's own API. So we treated the outage the way we teach debugging in the Dojo: stop guessing, start measuring, and write every finding down before moving on.
The measurements told a strange story.
Forty fetches of / returned two different entry chunks: thirty four naming one build, six naming another. The same asset URL answered 200 to curl twenty times in a row, and 404 to a headless Chromium asking moments later. Three consecutive fresh page loads failed on three different sets of assets. And the platform's API reported numInstances: 2 for a service whose configuration pinned it to exactly one instance.
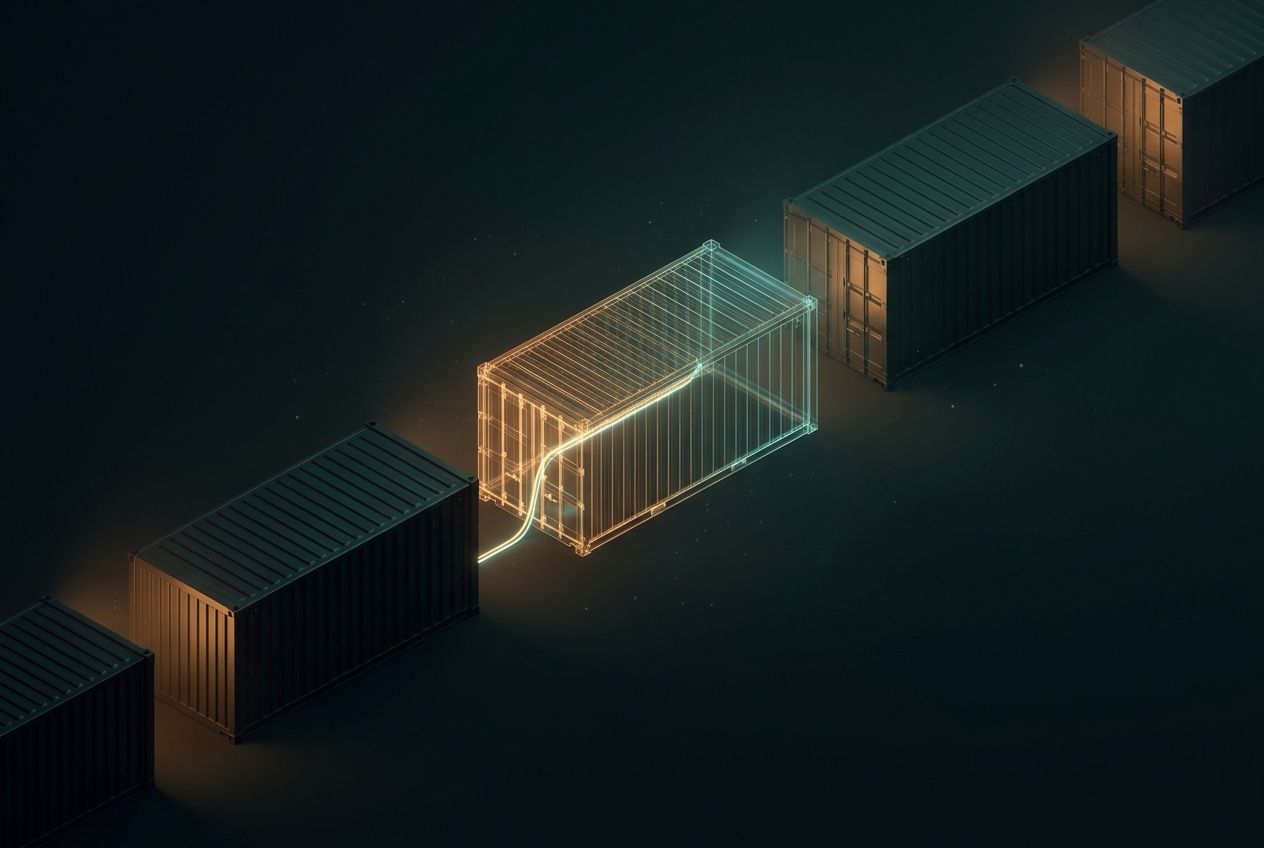
One of those facts alone is a curiosity. Together they are a fingerprint: two containers, running two different builds, behind one hostname. A browser was handed the HTML from one container and requested that build's chunks; the request landed on the other container, which had never heard of them, 404ed, and our SPA fallback answered the 404 with HTML. Hence the impossible error.
There was a second fingerprint hiding in the deploy logs. Deploys of our main branch were completing in two seconds, every layer cached, including the COPY that brings in the source, on commits whose source had demonstrably changed. Branch deploys of the same repository took twenty seconds and built properly. We fingerprinted the served bundle and confirmed the worst version of it: eight merged pull requests had never gone live, days after merging, while every deploy reported success.
Two bugs, then. An orphan container the platform did not know it was running, and a build cache handing back stale images on precisely the branch that auto-deploys to production.
Workarounds first, then the report
We got ourselves unblocked the unglamorous way. Scaling the service to two instances and back to one forced the orchestrator to reconcile its containers and evicted the orphan. A BUILD_REV build argument above the COPY in our Dockerfile broke the poisoned cache chain and forced a genuine build. The site came back. We could have stopped there.
But both faults were plainly platform bugs, and both were going to recur, for us and for every other team on the platform. So we wrote the report we would want to receive: service identifiers, deploy ids to look up, the 34-to-6 split of entry hashes, the same-URL 200-versus-404 evidence, the numInstances drift against the pinned configuration, the two-second cache-hit builds against twenty-second real ones, and the exact workarounds with our reasoning for why each one worked. Not a complaint. Evidence.
What came back
The reply from HostStack's engineering team opened by calling it one of the most useful bug reports they had received, and then did something better than flattery: it explained both root causes precisely and shipped fixes for both.
The orphan turned out to be a routing subtlety. For a single-instance service, their proxy routed to a shared internal DNS name that every container of the service registers, and Docker's DNS round-robins across every container holding that name. A leftover container from an old build silently rejoined the rotation. That explained everything we had observed from outside: redeploys replaced only the container the platform tracked, suspend removed the route but not the stray, and scaling to two rewrote the route to an explicit list that happened to exclude the orphan, which is why our workaround worked while the count stayed wrong.
The stale builds were a race. Their builder cloned the branch by name rather than pinning the commit being deployed, and a merge to an auto-deploying branch could resolve a slightly stale branch tip. Stale source matched a cached layer, and the previous image shipped again under a green tick. Feature branches deploy later, after the ref settles, which is why they always built correctly.
Five fixes went out on their side: scale-downs now genuinely drain surplus containers, every deploy reaps stray containers carrying the service's identity, the live replica count stops drifting, every build is pinned to the exact commit it deploys and fails loudly on a mismatch, and their generated Dockerfiles gained the same cache-busting move we had reached for by hand. Our specific stale container was removed by name. Every question we asked got a direct answer, and the one feature we wished for, a way to see and evict the containers behind a service, went onto their list.
Both bugs are the kind that is near impossible to see from inside the platform and merely very difficult to see from outside it. They got fixed because someone outside did the seeing, and someone inside took it seriously.
The reproducible move
You can fingerprint a platform from the outside with nothing but a shell. When a deploy misbehaves, measure before you theorise:
# Are two builds serving under one name? Sample the entry chunk.
for i in $(seq 1 40); do
  curl -s https://your-app.example/ | grep -o 'entry/[a-z]*\.[^"]*\.js' | head -1
done | sort | uniq -c

# Does the same URL answer differently by container? Count statuses.
for i in $(seq 1 20); do
  curl -s -o /dev/null -w "%{http_code} %{content_type}\n" https://your-app.example/known-asset.js
done | sort | uniq -c
Then put the platform's own numbers beside your own: the configured instance count against the reported one, the build duration of this deploy against the last known genuine build, the timestamp your bundle reports against the commit the deploy claims. A healthy platform produces boring, consistent answers. Any split is a fingerprint, and a fingerprint is what turns "your platform is broken" into a report an engineer can act on in an afternoon.
Why we bother
Here is the part we most want to say to other European teams.
When the outage hit, the easy conversation was available to us: shrug, mutter about platform maturity, and migrate to one of the three usual hyperscalers. Everyone has heard that conversation. It is how ecosystems stay small.
We had the other conversation instead. We stayed, measured, wrote it up, and sent it in. Within days, a platform used by many teams besides us had five real fixes shipped, our workarounds became unnecessary, and the engineers on the other side knew their proxy layer better than they had the week before. The Dojo got a more reliable home. HostStack got a better product. The report cost us an afternoon.
Infrastructure sovereignty is discussed in Europe as if it were a procurement question. It is not. It is a practice. European platforms become dependable the same way any software becomes dependable: by being used in anger, broken honestly, reported rigorously, and fixed quickly. Small teams like ours are not merely customers of that process. We are half of it.
So pick the European tool where it plausibly fits. Run real workloads on it. And when it breaks, do the vendor the courtesy of a report written like evidence rather than a complaint written like a review. The kind of reply we got this week is what that courtesy buys, and it compounds for everyone who builds on the same ground after us.
The container that wasn't there is gone now. What remains is better: two products improved, one working relationship, and a debugging story our learners will hear in the Dojo for years.
This story has a follow-up. Two weeks after we published this post, the same error came back, the orphans turned out to be our own pull request previews, and one of our two diagnoses turned out to be wrong. Read The Previews That Served Production.